BASIC TERMS
Corsi and Fenwick - Corsi is just a fancy name for shot attempts. A Corsi event is a blocked shot, missed shot, shot, or goal. Fenwick is exactly the same as Corsi but excludes blocked shots. So a Fenwick event is a missed shot, shot, or goal.
CF% (or SAT%) and FF% (or USAT%) - CF%, or Corsi For%, is the percentage of shot attempts directed at the opponent's net rather than yours. It is Corsi For (CF) divided by Corsi For plus Corsi Against (CA). FF%, or Fenwick For%, is the same thing, but with Fenwick For (FF) and Fenwick Against (FA) instead of Corsi. CF% and FF% can be measured relative to the player's team's CF% while the player is off ice by subtracting the player's CF% from the team's CF% when he's not on ice. This is called CF% rel. or FF% rel. CF% is also called SAT% (for Shot ATtempt%) or SATF% (for Shot ATtempt For%) as a result of an advanced stats rebranding by the NHL when they introduced advanced stats onto their official statistics page. FF% is called USAT% (for Unblocked Shot ATtempt%) as a result of the rebranding. While SAT% and USAT% make more sense that CF% and FF%, I'm just used to using Corsi and Fenwick, so I'll stick with that.
HERO charts - A HERO chart is a chart that displays a players rankings in a bar graph format. That's why it's called a HERO chart - HERO stands for Horizontal Evaluative Rankings Optic. The lines on a graph mark how well a typical fourth, third, second, and first-liner would do in the metric being measured. Or, with defensemen, how well a bottom-pairing, second-pairing, and top-pairing D-man would do. Here's an example:
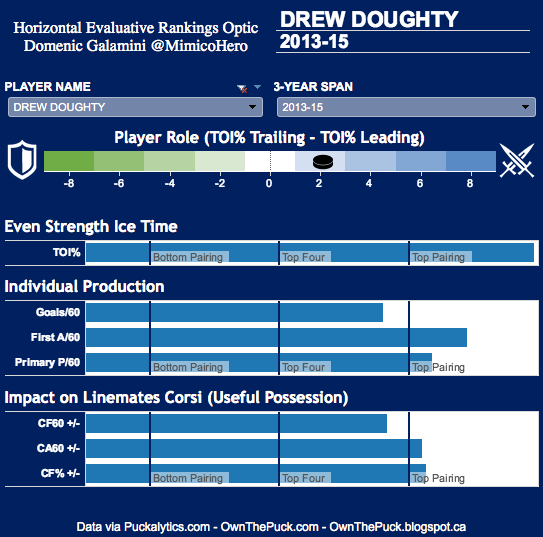
From this we can tell that Drew Doughty is a top-pairing defenseman in nearly every respect and is also being used in a slightly offensive role.
OppCF% and TMCF% - OppCF% (which stands for Opponent CF%) is a weighted average of the CF% of the opponents a player faces. TMCF% (which stands for TeaMmate CF%) is the same thing, but with your teammates instead of your opponents. OppCF% and TMCF% can have a large impact on a player's numbers. However, both are just one way to measure quality of competition (QoC) and quality of teammates (QoT).
PDO (or SPSV%) - PDO is team shooting percentage plus team save percentage. Since the mathematically defined average of PDO is 1000 (or 100.0, depending on how you write it), teams with a very high PDO (usually above 1010) tend to get worse over the long term and a team with a low PDO (below 995) tend to get better in the long run. This is called regression to the mean. As a result of the aforementioned advanced stats rebrand, PDO is also called SPSV% (for Shooting Plus SaVe%)
Rate Stats - Rate stats are stats divided by a player's TOI divided by 60, or, rarely, 20, since there are 60 minutes in a game and 20 minutes in a period. Rate stats provide a more accurate measure of pound-for-pound production than per-game stats because while per-game stats count all games equally, rate stats count a five-minute game for what it was - a scant at best contribution to the team. Rate stats simply have a "60" or "20" attached to them: goals per 60 minutes becomes G60, Corsi For per 60 minutes becomes CF60, etc.
Zone Starts (ZS) - Zone Starts are an integral tool used to establish context for both basic stats (i.e. goals and assists) and advanced stats (i.e. CF% and FF%). Zone Starts are usually measured with Offensive Zone Start% (OZS%), or the percentage of times a player "starts" his shift in the offensive zone. A "start" is the first faceoff a player takes in his shift. They can be used to categorize players (for example, a forward with a high OZS% is used as an offense-first player rather than a shutdown player), or to add context to a player's numbers ("the guy has a 58% OZS. It's not hard to have good numbers when you're 200 feet away from your own net"). OZS% ignores neutral zone starts, because even the very best neutral zone faceoff artists only add about 0.03 shots to the team's total. However, it's worth noting that some research shows that zone starts have only a minor effect on possession numbers.
Temmate-Adjusted Statistics - Teammate-adjusted statistics are possession statistics (such as CF% or FF%) that have been adjusted for a player's quality of teammates, which can have a big impact on a player's raw statistics. For the methodology, click here. Note: Unless stated otherwise, all teammate-adjusted statistics are calculated based on a player's statistics during the three most recent NHL seasons.
GOALIE STATS
Adjusted Save Percentage (AdjSV%) - Adjusted save percentage is save percentage adjusted for shot quality. The makers of this metric at War on Ice found three "danger zones" in the offensive zone: the high-probability zone, where shooters score over 10% of the time, the medium-probability zone, where shooters score 3.1-10% of the time, and the low-probability zone, where shooters score less than 3% of the time. You can see where the danger zones are here. Anyway, adjusted save percentage is calculated by mulitplying the save percentage on low-probability shots by low-probability shots against, then multiplying save percentage on medium shots by medium-probability shots against, then multiplying save percentage on high shots by high-probability shots against. Then, add it all up and divide by total shots against. This blog post explains it better.
Goals Against%- (GA%-) - Goals Against%- is defined by its creator as "the goals allowed percentage relative to league average". It is calculated by dividing the number of saves a goalie makes against the goalie's shots against multiplied by the league average save percentage. A GA%- of 100 means the goalie had a league average save percentage. Lower is better.
Goals Saved Above Average (GSAA) - Goals Saved Above Average is a statistic that measures how well a goalie is doing versus the league average goalie. It is calculating by subtracting the league average save percentage multiplied by the goalie's shots against from the number of saves the actual goalie made. It's a nice statistic to pull out when comparing one goalie to another. However, GSAA favors goalies who have a bigger workload over equally good goalies with less shots against. While some might argue that's a good thing - goalies are being rewarded for performing well under a heavy workload - most see it as a flaw in the stat. However, it is easily fixed by subsituting shots against for shots against per 60 minutes and saves for saves per 60 minutes. This is called Goals Saved Above Average per 60 minutes (GSAA/60).
Bailouts (BO), Quality Starts (QS), and Really Bad Starts (RBS) - A quality start is when a goalie either has a save percentage above league average or have a save percentage of at least .885 or fewer while allowing two goals or less on less than 20 shots. When a goalie has a quality start, he wins 78% A really bad start is when a goalie has a save percentage of .884 or worse during a game. When a goalie has a really bad start, his team wins just 25% of the time. A bailout is what would've been a really bad start but the goalie wins anyway. Quality start percentage (QS%) is the percentage of games started in which a goalie has a quality start.
All Statistics at Hockeygoalies.org - Hockeygoalies.org is a great site with all the basic stats for goalies (wins, losses, save percentage, GAA) as well as a lot of advanced stats, such as Support Neutral Winning Percentage (SNW%) and Goals Above Replacement (GAR), which is like GSAA but subsitutes league average save percentage for the league average minus .015. For the full list of stats at hockeygoalies.org, click here.
